- Ryan McAbee
- |
- March 18, 2020
RSA offers a quarterly “Build a Better In-plant Tips newsletter” to email subscribers. By special request, we are offering this issue as a blog post. To receive our quarterly tips to help you build a better in-plant, sign up today.
RSA and I ended 2019 with "Three Questions to Explore to Build a Data-Driven In-plant in 2020." Each quarter of 2020 I am offering tips about how to build a data-driven in-plant. Data is a critical part of the industry's – and your – future.
Almost three months of print operations have passed, giving you an opportunity to review a quarter's worth of financial and operational data to understand if your in-plant is hitting its performance metrics.
While no two in-plants operate the same way, ongoing research by Keypoint Intelligence – InfoTrends finds the better performing printers (as reported by higher sales revenue growth) focused more on two specific key performance indicators (KPIs) – Cost of Goods Sold (COGS) and equipment uptime.
- Know Your COGS
In our early 2020 European research, in-plants who took the survey shared that they focus on profitability. Some looked at overall profitability, while others tracked it at the customer or product levels. While profitability is critical for the continued financial success of any print shop, it does not provide insight into the underlying cost structure. A print shop can be making money but still be burdened with high costs (labor, material, overhead) that limit additional growth or investment opportunities.
Less than 50% of in-plants in the research focused on their COGS, or the direct costs of producing printed products or other services including materials and direct labor. In comparison, leading commercial printers were as likely to focus on their bottom-line costs as opposed to their top line revenue. Direct costs are critical to control in any printing environment since ink/toner, substrates, and labor inputs make up most of the total cost.
Luckily, direct costs are more accessible for in-plants where overhead costs that include a percentage of the enterprise overhead are harder to calculate. In-plant managers should know their paper, ink, equipment running costs (maintenance and click charges), and labor costs. Because COGS is used to calculate gross profit, in-plants that monitor it as a KPI will also know how this influences profitability. - Focus on Equipment Uptime to Maximize Operations
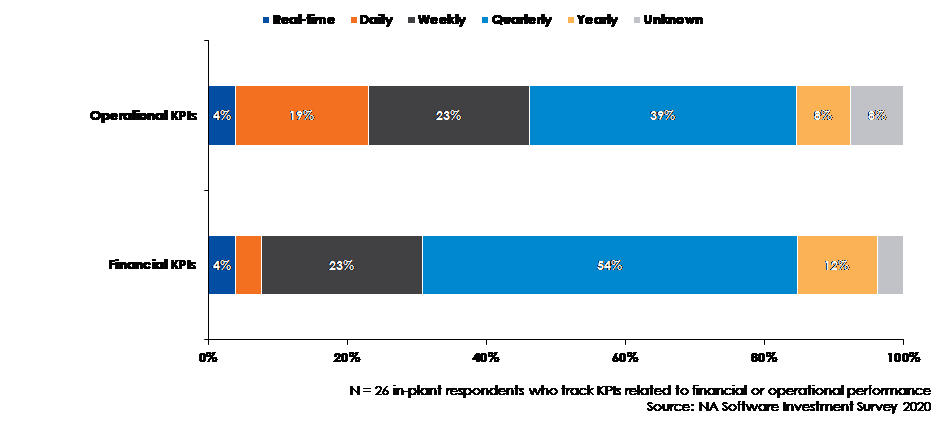
For monitoring operations, in-plants are more like other types of printing establishments. The three critical numbers survey respondents answered that they use to monitor operational performance and equipment uptime, sellable vs. rejected vs. wasted work, and productivity by employee.
Print establishments that focus on equipment uptime, and its utilization, again performed better than those that do not. Equipment uptime and utilization are direct, critical measures for the amount and level of efficiency of work that can flow through the in-plant. Production managers can compare these to previous weeks/months/years to spot and proactively correct production challenges.
- Software is Required to Collect Data
Collecting and monitoring COGS and equipment uptime/utilization cannot be done through sticky notes, job tickets, or even sophisticated spreadsheets. Data must be captured at every step in the production process. Accounting software is the conduit to COGS while equipment utilization is likely tracked through an enterprise resource planning (ERP) or print management information system (MIS). Depending upon the software solutions involved, some information can be collected, viewed and reported on through a custom dashboard using this feature in a product such as RSA's WebCRD.
Takeaway: Tracking Costs and Equipment Uptime and Utilization are Key
The key takeaway is that in-plants should track bottom line costs and equipment uptime and utilization to improve operations and value to the parent organization. The latter provides faster feedback on the day-to-day performance to spot issues where financial metrics provide historical perspective on the operation.
Join Us for the Next Topic In This Series
Join us next quarter as we dive into topic number two, the means and methods for creating a culture and tools for collecting key operational data.
Contact RSA for additional tips or to discuss how you can implement and benefit from these three tips.