- Howie Fenton
- |
- November 22, 2017

This article is part of our dealer and vendor in-plant education initiative called "In-Plant Primer: From Operations Basics to Advanced Sales Concepts." Divided into six basic (101) and six advanced topics, this is the fifth post of the advanced in-plant primer series, "In-Plant Primer 201: Operational and Financial Concerns." In this advanced portion of the primer series, we're covering topics like financial models, terms to use and avoid with in-plants, the differing views of an in-plant's value and benefits, and more.
Key Take Aways
- Often "clicks," pages, or sheets printed is used as a metric, but it may not be the best metric
- The sales per employee (SPE) ratio is the most common metric of performance, but it is not always predictive of success
- The best metrics are actionable and consistent with how you are evaluated.
Is the Data You Report Actionable?
Often what is measured most in production print is the least useful. Since most digital press manufacturers count clicks/month (pages or sheets of paper), it is the easiest data to collect, but it has limited value because it is not actionable. While an indication of page volume, page counts are generally not actionable. One way to determine if data is actionable is to ask, "What could I change if this data (page counts) increased or decreased?" Actionable data means you make a change and determine if that change helped or hurt your measurement, which in this case is page count. In contrast, if you could change something based on page count, that measure would be actionable. For example, some in-plants are in-sourcing work, which means selling to outside companies. For an in-plant selling printing externally, you could offer lower pricing when volumes increase, which would make that data actionable.
Internal Customize Your Metrics Based on How You are Evaluated
Arguably, the most common metric of performance is the sales per employee (SPE) ratio. It is easy to calculate by simply dividing the number of staff into the dollar volume of sales. It is commonly used in both commercial printing and in-plants, but I don't consider it alone as a strong predictor of leadership. Why? Because I have worked with some in-plants whose SPE was considered low (less than $110K/person), but were world class, and others that appeared as leaders (over $140K/person) that were outsourced. SPE ratios are different for diverse types of companies such as: graphic arts in-plant printers, quick printers, mailing service providers, and transactional in-plant printers. For example, the industry average for a commercial printer may be $135K/employee but it may be $180 K/employee for a transactional in-plant printer. What is a good measurement for one in-plant might be bad for another. A school district in California has begun using turnaround time as the actionable data they track and report. When we first worked with them a few years ago, their turnaround time was six weeks, which was considered too long. After implementing recommendations about staffing and adding a Web to print solution (RSA's WebCRD), their turnaround times shrank to four weeks. Over the subsequent two years as demand increased, their turnaround times grew again, and they knew that action was required again.
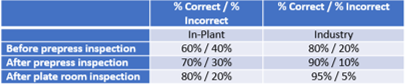
For another in-plant, the best measurement was the number of mistakes or rework. They were an offset printing facility and were struggling with quality issues and had set up an elaborate inspection process in which three or four people went through elaborate inspection steps to catch mistakes. The best metric for them was to increase the percentage of correct work and decrease the percent of incorrect work at each inspection step.
Summary
One common mistake when trying to identify a metric to monitor production print is an easy measurement such as pages printed. The key to a good metric is that you can make a change, such as adding a quality inspection step, and determine if it helped achieve the desired effect (increase page volume). However, if a quality inspection step was added and was effective it would reduce mistakes and result in lower page volumes. The conclusion could be that this action was not effective, when in reality it was very effective at reducing rework. Change the metric to waste or the number of reworked pages and now you have a good measure. Often the easiest metric is not the right one. What are your best metrics? In our final 201 primer article I'll discuss how software automation increases the value an in-plant print center.
Become An In-plant Expert
Access your RSA partner resource portal to download the two series eBooks or listen to the August 23 webinar recording about all the topics.