- Howie Fenton
- |
- May 13, 2020
Outlining a plan for reducing expenses is unpleasant but your administration may request it as we emerge from this pandemic. It may also be needed during other financially challenging times. We recently received a call from an in-plant that was asked to submit a plan showing how they would reduce expenses if the parent company experienced losses in revenue. Staffing costs are often one of the largest in-plant expenses. It is impossible to estimate how reductions in parent company revenue will impact the in-plant, but we will outline a plan for managing staffing levels. The spreadsheet we offer below will show you how to estimate staffing needs, visualize reductions, and suggests when to hire as revenue increases.
Before we explain how to build your staffing spreadsheet, we feel that it is important to inform administration that reducing staffing may jeopardize on-time deliveries or SLAs (service-level agreements). It seems clear to us but might not be obvious to them. In the simplest of terms, working with less staff makes it less likely you will meet your SLAs, because cutting staff creates holes or gaps in your workflow.
You may have to move people around and cross train them if you need to work with fewer staff, but without adding additional automation it will likely take longer to implement a cross training program. The best place to add automation is to fill any gap or bottleneck that is created if you lose a staff member. The two most common automation tools are Web to print software and in-line or near line finishing. Web to print helps overcome bottlenecks in estimating, order entry, scheduling, and billing. In-line or near line finishing helps overcome bottlenecks in collation and finishing. Another strategy that would help reduce the impact to SLAs would be cross training, but that is more time consuming.
Using KPIs and a Spreadsheet to Identify Staffing Levels.
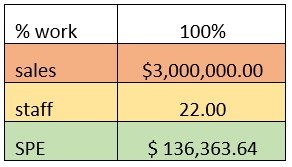
One way to estimate staff levels uses the sales per employee ratio (SPE). The SPE ratio is one of the most popular measures and benchmarks of staff labor load. If you have $3M in revenue and 22 staff the ratio is calculated as $3,000,000/22 = $136,363/person which is considered average.
For this exercise it's not important to benchmark your SPE to others. You can simply say this is the SPE based on current staff, level of automation, and SLAs. Using a spreadsheet, you can calculate your staffing if revenue decreases or increases.
Start by creating an SPE chart with 6 columns across and 4 rows down. Build the first two rows as you see below with 100% revenue, current sales, current staff. Next, divide sales by the number of staff to calculate your SPE.
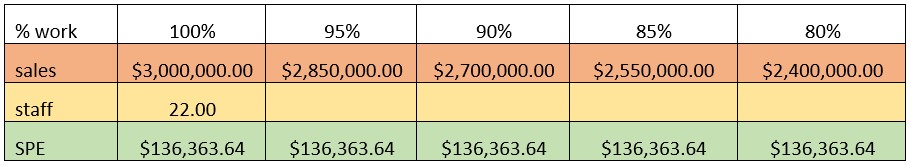
In the columns to the right of "100% work" you can fill in possible sales declines. Start with these suggestions, but once this is built you can change any numbers and the spreadsheet will automatically recalculate.

To fill in the other sales cells, multiply the current sales ($3M) with each percent ($3M x 95% = 2.85M)

Since we want the SPE to remain constant, you need to copy the SPE for 100% to all other SPE cells (= SPE cell). This will allow you to change the sales and staff numbers and automatically recalculate all the SPE cells with the same ratio.

If everything was input correctly your spreadsheet should look this:
Last, to figure out your staff number you divide each column's sales by the SPE (2,850,000/136,363= for 20.9).
Your final spreadsheet should look like this:
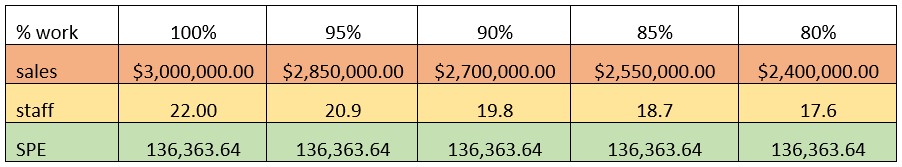
If everything was done correctly you can change your sales percent reductions, current sales or current staffing. In this example we see that a 5% reduction (95% work) in revenue means one less person (22 staff – 20.9staff = 1.1 less staff), a 10% reduction shows two less staff (22 staff -19.8 staff =2.2 less staff), etc.
There are other ways to calculate staffing levels such as the payroll as percentage of revenue (PAPR)– benchmark, but we like this because it is easy to use and easy to explain. If the SPE spreadsheet does not work for you, email me at howie@howiefentonconsulting.com and we will send you an example spreadsheet.
Contact RSA Today
If you would like to discuss how workflow automation can reduce gaps and bottlenecks in your workflow, contact RSA to learn more.