- Howie Fenton
- |
- July 17, 2020
There is a growing demand for a new feature in software called dashboards. These business dashboards are based on your car’s dashboard which shows the critical information you need to drive your car such as speed, fuel, oil, temperature, tire pressure etc.
The growing interest in business dashboards became clear to me on a recent assignment with a State printer.
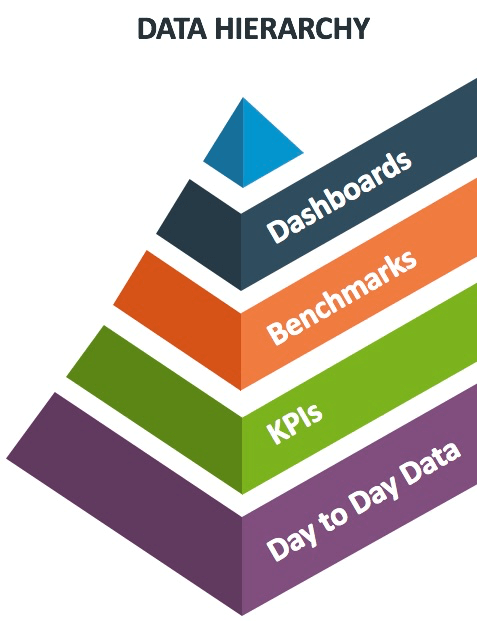
Ironically, the interest in business dashboards did not come from the in-plant staff but instead from upper management and other agencies with oversight responsibilities. Dashboards are typically more of a graphical display like a gauge in your car, and they can display day to day data, key performance indicators (KPIs) or benchmarks. In this article you will learn about trends from leading in-plants in using these three traditional metrics and the emerging trend for dashboards, as well.
Day to Day Data
The first level of data supports day to day operations. This information includes monitoring staff hours, billing, receivables, quality checks and perhaps the most important routine data, which is the production schedule.
KPIs (Key Performance Indicators)
KPIs are one step higher in the data hierarchy because they are less about day to day operations and more about trends impacting business objectives. Leaders divide KPIs into high and low level KPIs. High level KPIs are more strategic and low level KPIs are more tactical.
For instance, a high level KPI may focus on year to date financials, such as billable revenue. If you are 75% toward the revenue goal 65% into your calendar year you are in good shape. An example of a low level KPIs is the comparison of estimated vs. actual (time or cost). If after performing postmortems for three months you discover that your estimated (time or cost) is 25% lower than your actual (time or cost), then you have a problem.
Benchmarking Performance
The purpose of benchmarks is to compare performance. Some of the most frequently asked benchmarking questions from leading companies include: "Are we staffed correctly?" and "How does our performance compare to the leaders?". Many leading benchmarks are ratios such as the sales per employee ratio or payroll cost as a percentage of revenue.
Business Dashboards
The best dashboards can show you anything, including day to day information, KPIs and benchmarking data. Much like a car dashboard, business dashboards can show you when something is wrong (or right).
The idea of business dashboards is not new. I recall in 2005 listening to Tim Fischer the COO at NAPL talk about dashboards in the NAPL Management Institute. What is new is that dashboards have become a mainstream management tool and now upper management may request access to dashboards.
Business dashboards can provide feedback about run rates of equipment or show when equipment is running slow or down. Dashboards can show performance metrics such as percentage of on-time delivery or the length of a work backlog. They can evaluate sales and marketing tactics such as sales resulting from open houses or email campaigns.
One of the main problems, however, is the lack of availability of business dashboards. Most of the software we have been evaluating over the last year does not provide dashboards. In fact, the common response we heard when we asked vendors about dashboards was the suggestion to hire a value-added reseller to extract data and display it in a dashboard.
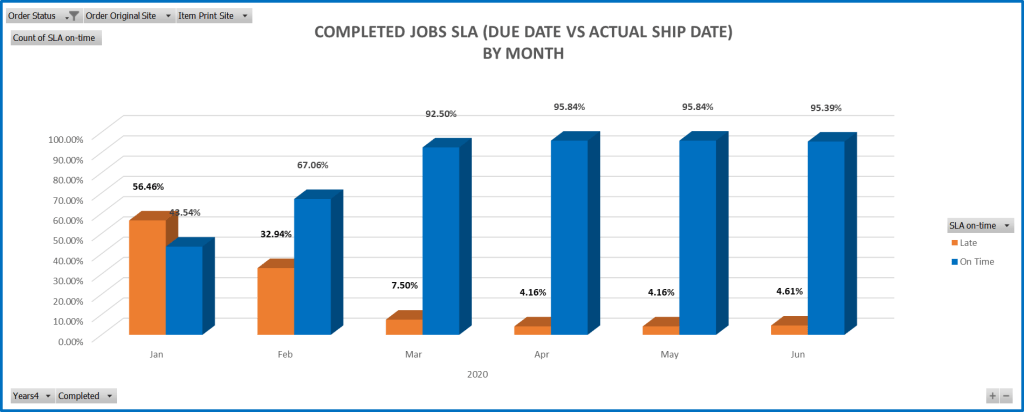
One of the few companies that offers a dashboard is Rochester Software Associates (RSA). The graphic below shows an RSA WebCRD Web to print and production management dashboard of on time delivery or month by month SLAs.

Learn More About Dashboards
If you want to see good examples of dashboards, download the RSA white paper entitled "Using your In-Plant data to Improve Efficiency" for this and several other examples.
Or contact RSA to learn more about the reporting and dashboard capabilities of WebCRD.